Key Takeaways
What the Cone Actually Shows
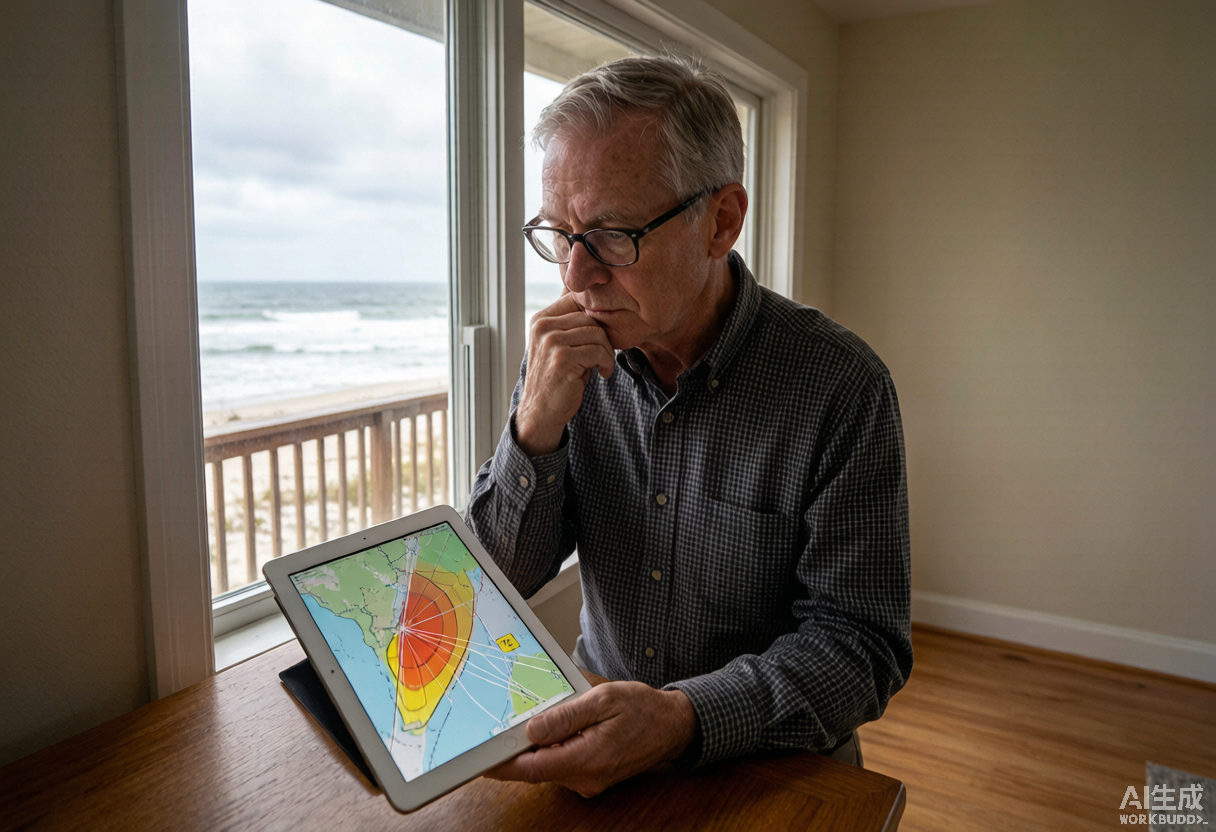
The cone is a visualization of forecast-track uncertainty. It is drawn so that the center of the storm is expected to remain inside the cone roughly two-thirds of the time, based on historical forecast errors. It is not a representation of the storm's size, impacts, or warning area.
What the Cone Does Not Show
Many people misread the cone and assume only the areas inside it are at risk. In reality, hazards can extend far outside the cone.
- The cone does not show storm size. Tropical-storm-force winds can reach dozens of miles outside the cone.
- The cone does not show storm surge or rainfall flooding, which can occur outside the track.
- The center line is not a wall; storms often track to the left or right of it.
- The cone widens with time because forecast uncertainty grows farther into the future.
How to Use the Cone in Decisions
Use the cone as one input among several. If your location is inside or near the cone, begin monitoring NHC advisories and local NWS alerts closely. If the cone shifts toward your area, move from preparation to action. If the cone shifts away, continue watching until the storm has passed, because cones can move back.
The NHC Impact Map (2026)
Starting May 15, 2026, the National Hurricane Center pairs the cone with an experimental-to-official impact map (also called the cone of concern). The impact map keeps the track cone but overlays color-coded watches and warnings for inland wind, storm surge, and flooding. It answers a different question than the cone: not just where the center may go, but where dangerous conditions are expected. Read the impact map first for safety decisions, then use the cone to understand how much the track can still shift.
Pair the Cone With Other NHC Products
The cone of uncertainty should be read alongside the storm surge watch/warning graphic, the rainfall forecast, the wind-field map, and the official discussion. Each product answers a different question: where, how high the water, how much rain, and how strong the wind.
Official Source Check
Before making a life-safety decision, check weather.gov, your local emergency management agency, and current NHC advisories. NOAA/NESDIS and NASA images in this article are public-domain source visuals.
Next Actions After Reading
Use the article for background, then move to the tracker, alert, city, or planning page that matches your current situation.
Translate watch, warning, surge, flood, tornado, and evacuation wording into household actions.
Check current NHC storm context, live map shortcuts, radar, and active alert pathways.
Move from general guidance to local storm surge, flooding, route, outage, and alert context.
Compare a ZIP code with current NHC storm positions and understand distance limits.